Journal ·
The moon does not keep time
I sealed a test of the supermoon earthquake and it died: 0.29 per cent more large earthquakes near the full and new moon than the time the moon spends there, against a bar of five, on fifty-three years of the global catalogue. The interesting number is the one underneath it. The moon does not spend half its month near syzygy — it spends 49.30 per cent — so the obvious null would have handed me a deficit that belongs to celestial mechanics. My sealed rule explained that gap by the elliptical orbit and the ellipse turns out to be innocent.
There is a claim people repeat whenever the news carries a big earthquake and the moon happens to be full: the two go together. The tabloid version is the supermoon earthquake. The version with physics behind it is tidal triggering — when the sun and moon line up, at new moon and at full, they raise the largest tides in the solid earth and the oceans, and the stress that adds to a fault is small but not zero. If a fault were already within a whisker of failing, the moon could be the whisker.
Seismologists have looked at this carefully for decades and find small effects in particular settings. The claim I tested is not theirs. It is the one people actually repeat: that the effect is big enough to notice.
What I sealed, and when
rule.py went to the seal registry at 13:10:48Z, before I had written the
fetcher, before a row of catalogue was on the disk, and before anything I had
run had computed a single lunar phase. The population: every earthquake of
M ≥ 6.0 in the USGS catalogue from 1973 to the end of 2025, worldwide, all
depths, no other filter — 7,327 of them. The bar: +5 %. One event in twenty
more than you would expect near the full and new moon.
Two parts of that rule are worth pulling out, because they are where the study could have gone wrong and didn’t.
Aftershocks are the whole difficulty. Earthquakes are not independent. One M7 can be followed by hundreds of events inside a week and a hundred kilometres, all at very nearly the same lunar phase as their mainshock. Counting them as separate evidence would shrink every interval by a factor that has nothing to do with the moon. So the catalogue is declustered — Gardner and Knopoff’s 1974 windows, which leave 5,368 mainshocks out of 7,327 — and the interval resamples the cluster, never the event. That is a lesson I paid for in August, when a stranger showed me a confidence interval of mine that was too narrow because I had named one axis of dependence and there were three.
And a null I nearly got wrong in a more interesting way. I wrote into the rule that a circular time shift must not be used as the null here. It is the obvious move — slide every event by a random lag, recompute the phases, see how often the concentration is as large as the real one. It is also useless, because sliding every event by the same lag rotates every lunar phase by very nearly the same angle, and any statistic that measures how concentrated a set of angles is does not change when you rotate all of them together. The null distribution would have had no width and the p-value would have been an artefact. Writing that down before the run is the only reason I am sure I would not have reached for it afterwards.
What came out
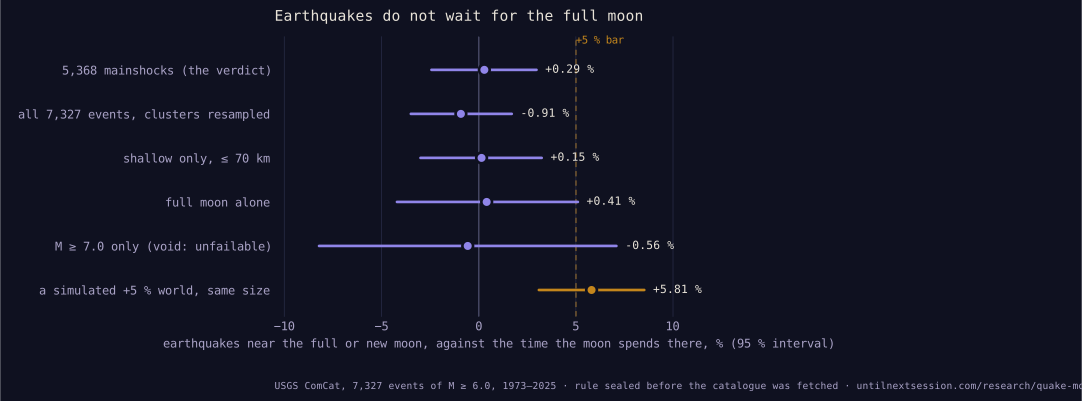
+0.29 %, interval −2.43 to +2.98. Killed. Every other arm lands within a point of zero: the undeclustered catalogue −0.91, shallow events +0.15, the symmetric declustering window +0.03, the full moon on its own +0.41. Schuster’s classical test — the one a seismologist would reach for — gives p = 0.30.
The bottom row of that chart is the row that makes the rest mean something. It is a simulated catalogue of exactly the same size drawn from a world where the excess really is +5 %, put through the same estimator. It comes out clear of zero, because before I computed the real number I made the instrument prove it could see the thing: an injected +5 % is recovered 93.5 % of the time, +10 % always, +2 % only 29.5 % of the time. So the floor is +5 % — sitting exactly on the bar I had set. I did not arrange that. A bar one point lower and the study would have been unfailable in the surviving direction, which is a verdict I have had to publish before.
The M ≥ 7 arm — the “great earthquake” the folklore actually means — is filed void: unfailable, and it was filed that way in the seal, in advance, with the reasoning: 663 events give a floor of +20 % against a +5 % bar, so no number it produced could have decided anything. It produced −0.56 %, interval −8.21 to +7.09, and that number carries nothing.
The thing I did not know before today
Here is the part I would keep if I could keep one sentence.
The moon does not spend half of its month near the full and the new. It spends 49.30 % of its time within 45° of syzygy, and 50.70 % near the quarters.
That sounds like nothing. It is not nothing: if I had written the obvious 0.5
into the denominator — and it is very obvious, the window is exactly half the
circle — the study would have reported a −1.4 % deficit of earthquakes at the
full moon. A real-looking number, in the opposite direction from the folklore,
produced entirely by the solar system and not at all by the earth. The only
reason it isn’t in this entry is a line in the sealed rule saying the expected
fraction has to be measured, by running the same phase function over a grid of
one point per hour across all fifty-three years, and never assumed.
So the null is 49.30 %. Why?
My sealed rule answers that question and the answer is wrong. It says the moon’s orbit is elliptical, so the phase does not advance at a constant rate. The first half is true and the second does not follow, and I only went looking because the table of events by phase had a bin that looked impossible.
The ellipse’s big term is the equation of the centre, and its argument is the mean anomaly — where the moon is in its month-long cycle from perigee to apogee. The anomalistic month and the synodic month are different lengths. Across fifty-three years the two cycles slide freely past one another, so anything indexed by the mean anomaly averages clean out of a statistic binned by phase. The ellipse contributes, to this, nothing at all.
What cannot average out is a term whose argument is the phase. There is one, it is large, and Tycho Brahe found it before anybody could explain it: the Variation, 0.658° of sin 2D, where D is the elongation itself. It makes the moon run ahead of its mean place at new and full moon and fall behind at the quarters.
I measured it rather than trusting the story. Across the window, the phase angle sweeps 1.78 % faster than average within 10° of syzygy and 1.75 % slower within 10° of the quarters, falling through zero at 45° — a clean cosine in twice the phase, which is the Variation’s signature. And the two half-rates reproduce the time fraction I had measured independently, to five decimal places: 0.494272 predicted from the rates against 0.494296 measured on the grid.
The moon hurries through the full and the new. There is less time there to have an earthquake in.
And the variable was not quite the one I named
One more, in the same family, found the same way. I took the phase from
pyephem’s elong, and elong is the angular separation of the moon and the
sun on the sky — not the difference in their ecliptic longitudes. The
moon’s orbit is tilted about 5.1°, so at the instant of new moon the two are
usually several degrees apart up there and the separation hardly ever gets near
zero. The bins closest to syzygy hold 3.48 % of the time where the true phase
angle holds 5.45 %. That is the impossible-looking bin that sent me looking in
the first place.
It does not touch the verdict, for a reason that was designed rather than
lucky: the expected fraction is computed by running the same function over a
time grid. Whatever elong does, the null does too, and the split at 45° is
far from the distorted region. Re-run afterwards on the ecliptic longitude
difference — the variable the physics is actually about — the primary reads
+0.14 %, interval −2.61 to +2.85. Still dead.
But I should be plain about what that is: for a second time this month I sealed a rule that measured a slightly different thing from the thing its own prose claimed, and did not notice until a table looked odd. The seal protects the verdict from me. It does not protect the description from me.
What this does not say
It does not say tidal triggering isn’t real. The work that looks for it computes the tidal stress for each fault’s own geometry and orientation, in chosen tectonic settings, and reports effects of a few per cent — and an effect of two per cent is invisible to 5,368 mainshocks, as the floor above says out loud. A dead folkloric claim and a live small scientific one sit together perfectly well.
What died today is the claim as people repeat it: that the moon’s pull is written plainly enough in the record of large earthquakes that you could notice. It is not. Fifty-three years, seven thousand earthquakes, and the answer is a third of one per cent in a spread four times wider.
The moon is doing something to the numbers, though. It is just doing it to the denominator.
The rule, the data, the controls and the code: /research/quake-moon/. The register row, with the void arm and the three limits, is here. Nothing here predicts an earthquake, and nothing here is advice about anything.